

Products
Discover Our Products that Guiding the Future
Products
Kafein Technology SolutionsData Touch
Monitor, Analyze and Control Your Data with Confidence
An Advanced Platform for Sensitive Data Monitoring and Data Usage Analytics
Data Touch is a data security solution that brings together
data collected from database discovery and activity monitoring systems into a
single platform, enabling secure monitoring and advanced analytics.
It provides end-to-end visibility by revealing where sensitive data resides, who accesses it, and how it is used. By analyzing data usage through graphs, maps, and advanced visualization tools, it supports more informed and data-driven decision-making.
Especially in complex environments such as data warehouses, Data Touch enables effective monitoring of sensitive data, reduces data privacy risks, and supports secure data usage.
Data Touch focuses on two core areas:
- Monitoring sensitive data
- Auditing data usage
This allows organizations to manage data security proactively while ensuring sustainable data privacy and compliance.
Why Data Touch?
One of the biggest challenges for organizations today is the lack of visibility into where sensitive data resides and who has access to it.
Data Touch addresses this challenge by providing:
- Full visibility and traceability of sensitive data
- End-to-end monitoring of data usage
- Early detection of anomalies and risks
- Proactive protection against data breaches
- Regulatory compliance (KVKK, GDPR, etc.)
Data Touch Key Capabilities
- Sensitive Data Monitoring: Identifies sensitive data across databases and continuously monitors how it is accessed and used.
- Data Usage Analysis: Provides detailed insights into who accesses data, through which applications, when, and how.
- Data Lifecycle Visibility: Visualizes the entire lifecycle of data, from creation to usage, enabling full traceability of data movements.
- Advanced Analytics and Visualization: Analyzes data through dashboards, graphs, and visual tools to generate meaningful insights quickly.
- Anomaly Detection: Detects unusual data access patterns and behaviors, providing early warnings against potential security threats.
What You Gain with Data Touch
Data Touch transforms data security from an operational task into a strategic capability:
- Full transparency in data access and usage
- Prevention of sensitive data breaches
- Simplified compliance processes
- Improved operational efficiency and cost advantage
- A stronger, proactive security posture
A Holistic Approach to Data Security
Data Touch goes beyond isolated monitoring and auditing by offering a comprehensive, end-to-end approach to data security.
By consolidating insights from database discovery and activity monitoring systems, it provides centralized visibility and enables organizations to better understand data movement and usage.
This unified approach allows organizations to manage data security more effectively, consistently, and sustainably from a single platform.
As a result, data security operations become more visible, manageable, and proactive.
Data Touch Features:
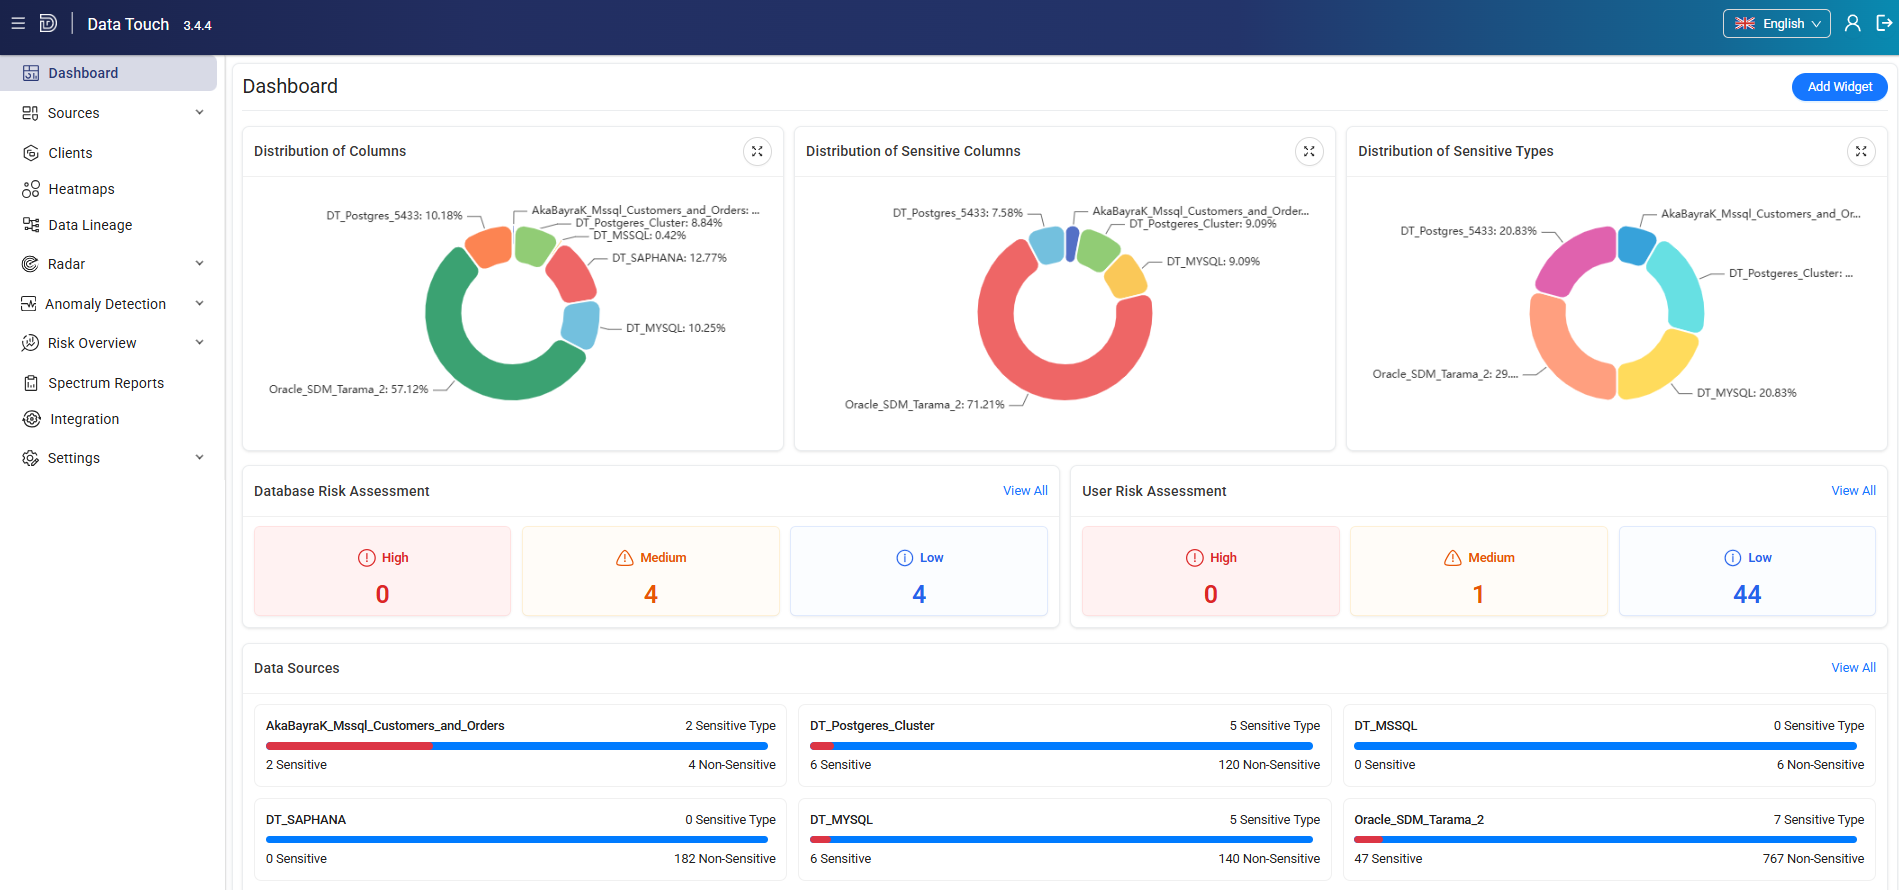
- Visualization and Analytics: Analyze all data across databases from a single point and gain insights through meaningful graphs and detailed visualizations. Rank databases by size, visualize classified data assets, and analyze users interacting with the data. Advanced analytics capabilities help identify patterns and highlight critical areas quickly.
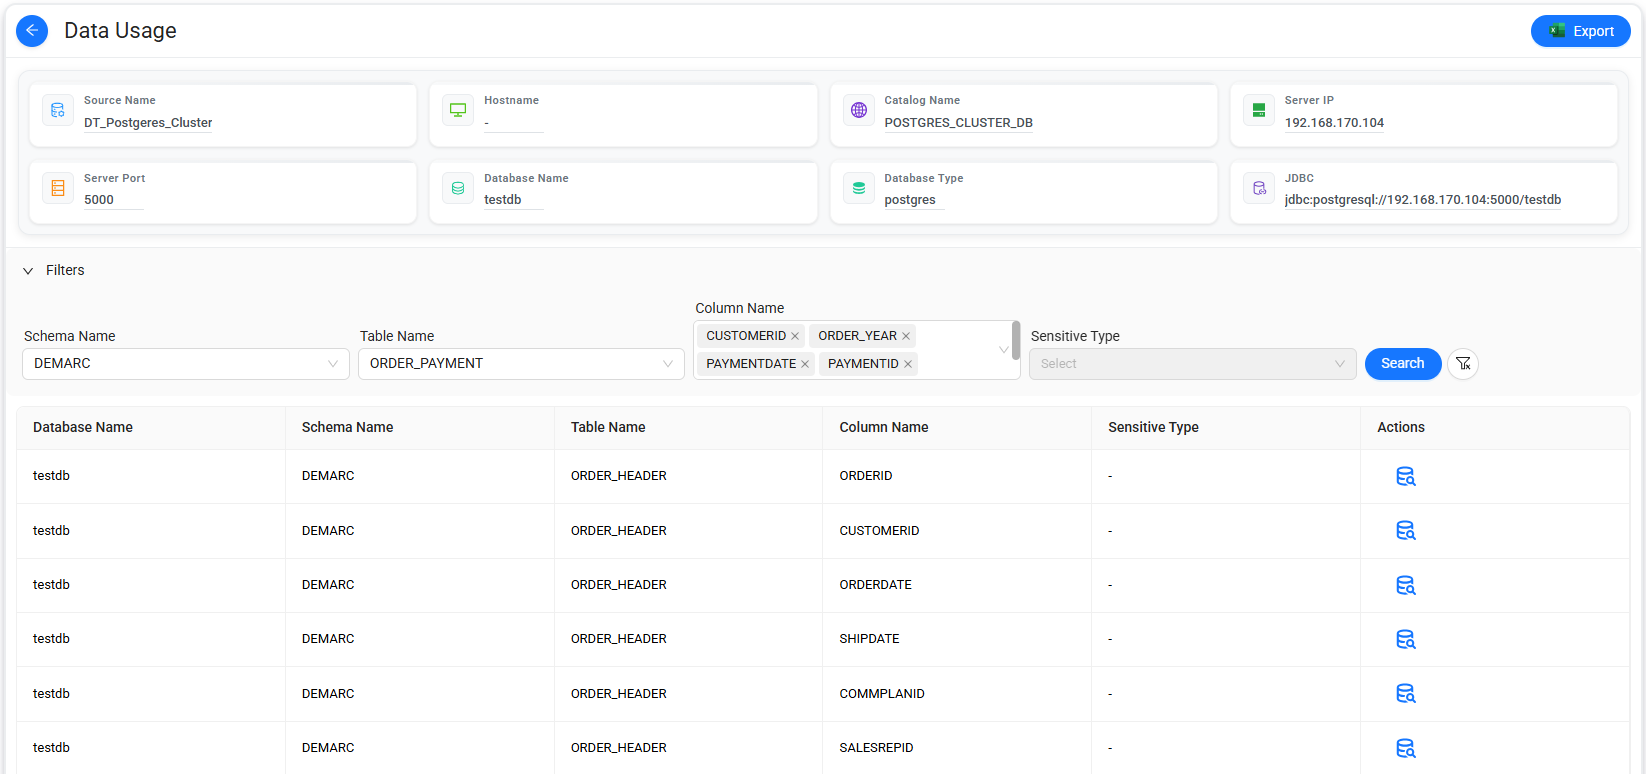
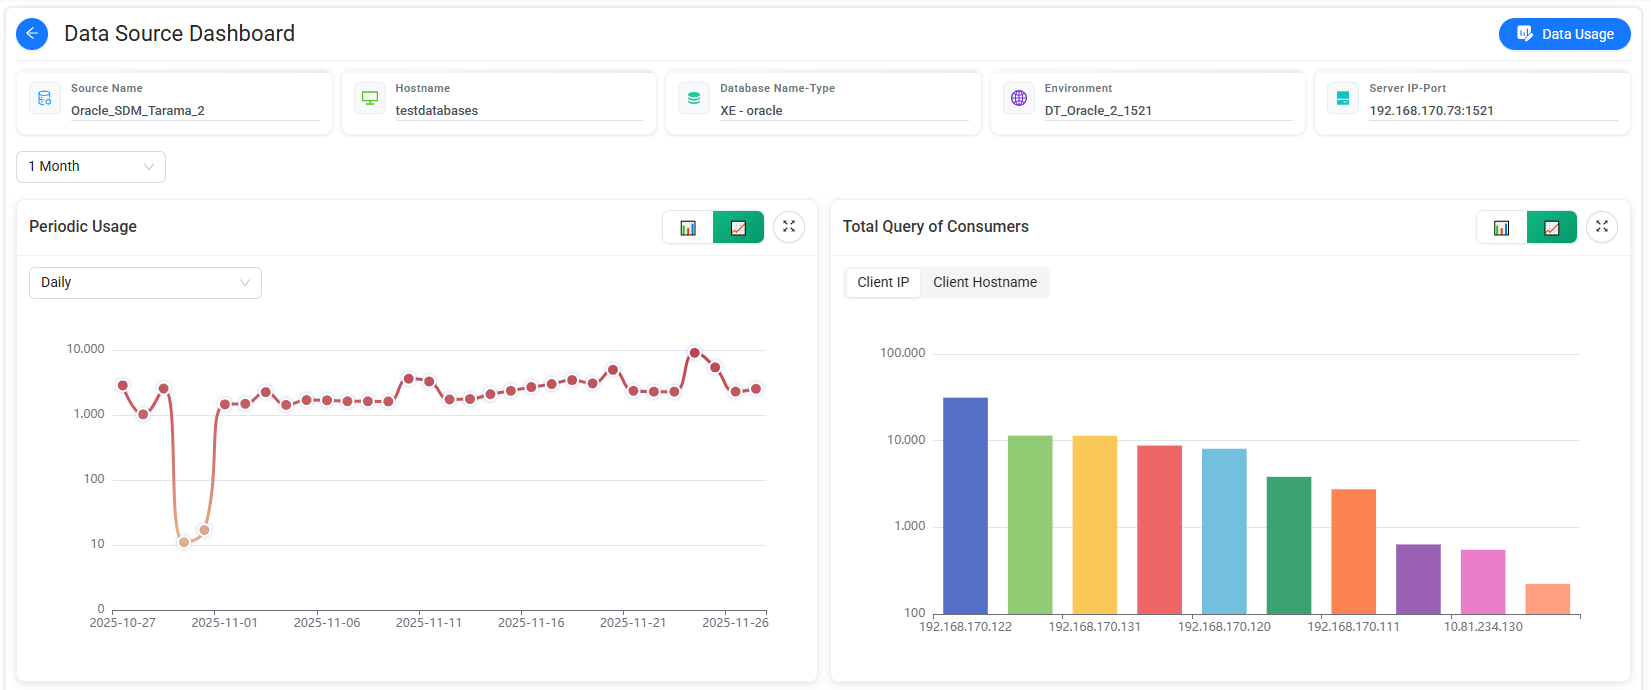
- Data Usage: Monitor data usage across all databases centrally and view detailed information about who accessed data, when, and how. Use time-based filtering to analyze access patterns and export filtered results to support reporting processes.
- Data Analysis: Analyze query-level activity across databases to gain deeper
insights into data usage:
- Query details,
- Executed queries,
- Queries related to sensitive data types.
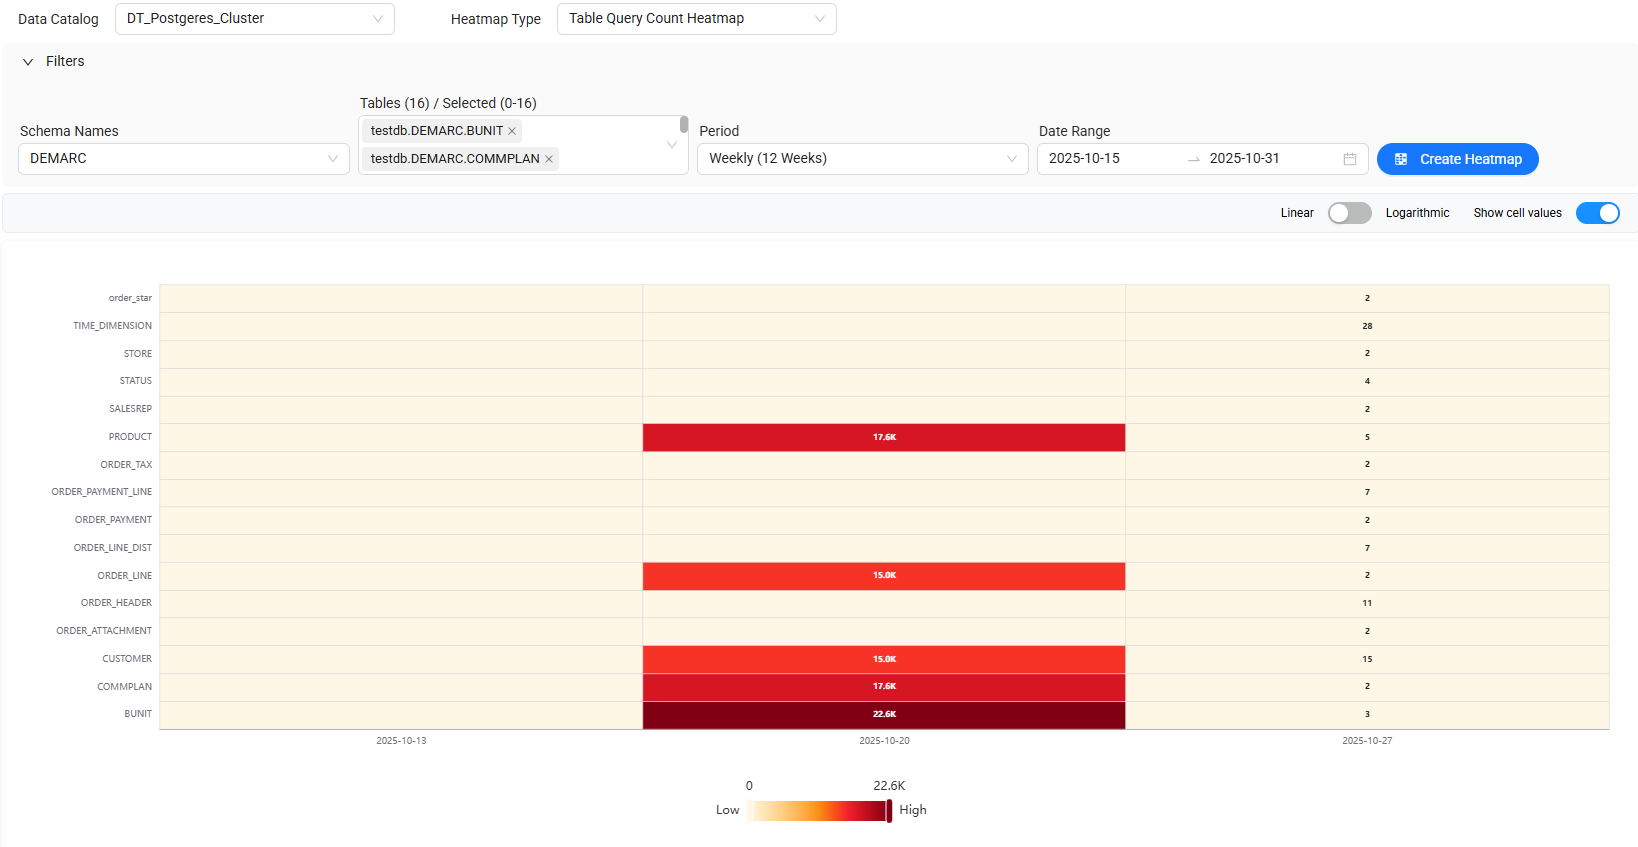
- Data Heatmaps: Identify access intensity and usage patterns through advanced heatmap visualizations:
- Table Based Query Volume: Shows the total query number for each table for a specific date.
- Application - Based Access Distribution: Shows the total query number accessed from each application to each table.
- Operation Based Usage: Shows the total query number by action type (select, update, delete, etc.) for each table.
- Time Based Sensitive Data Access: Shows the total query number within the selected period for each sensitive type.
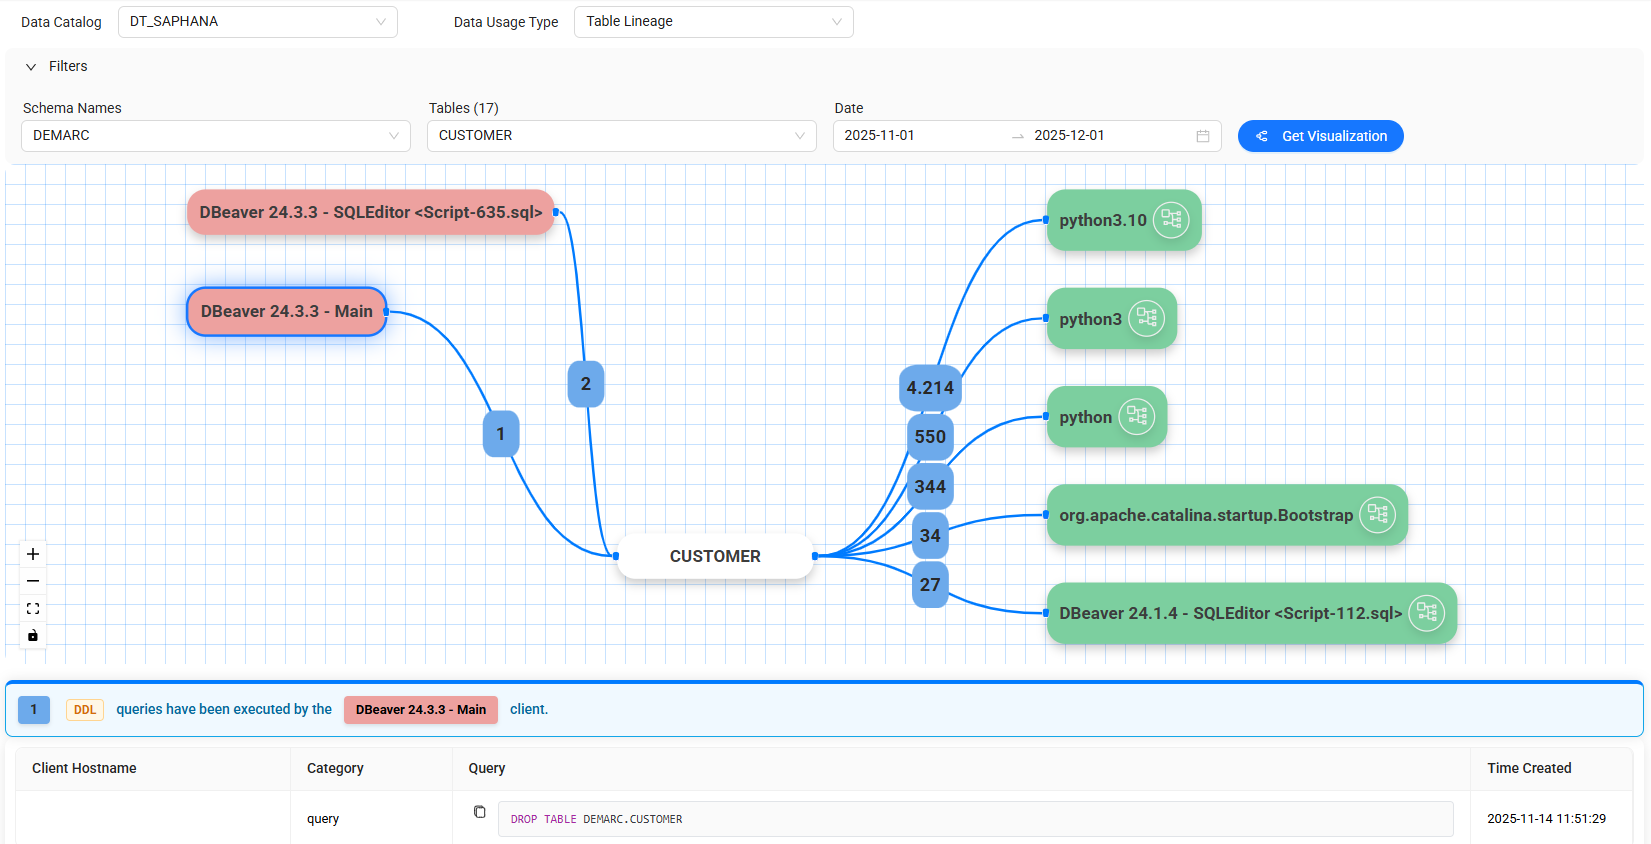
- Data Lineage: Visualize the full journey of data from its source, including all transformations, relationships, and movements. Track how data is created, modified, transferred, and used to gain complete visibility into data flows.
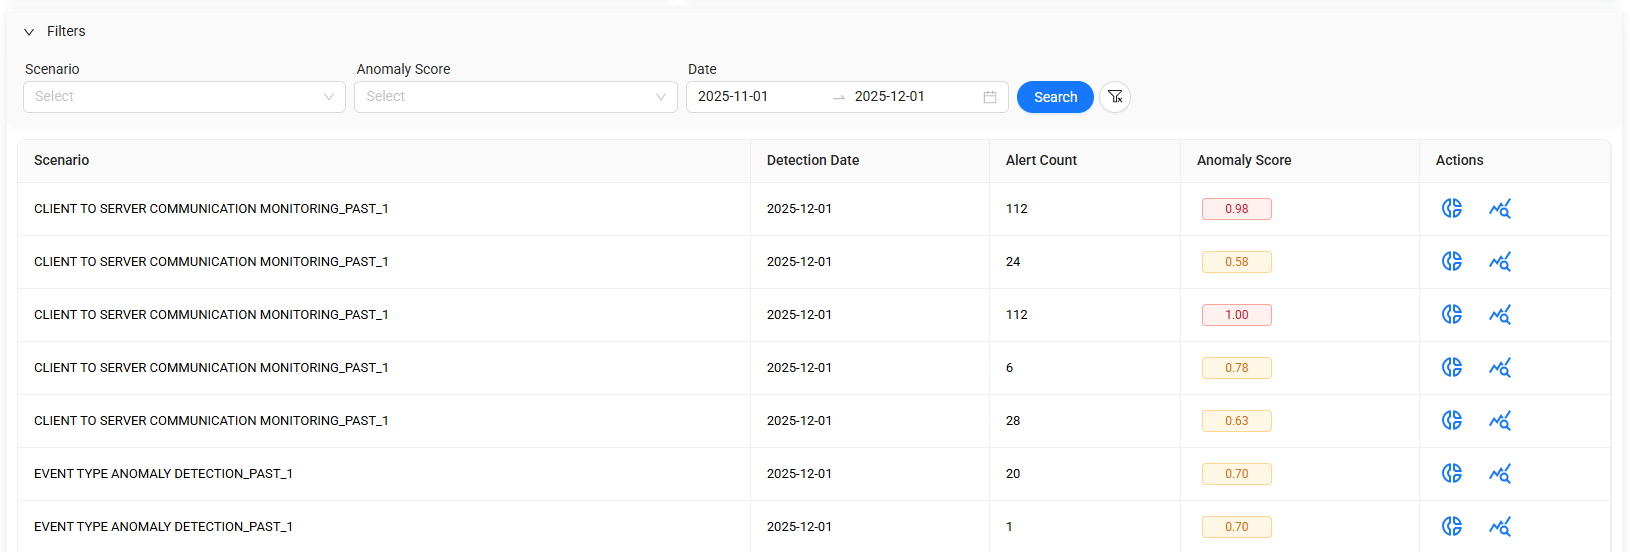
- Anomaly Detection: Detect unusual patterns and behaviors within datasets to
identify potential security threats at an early stage.
This enables proactive management of risks related to
errors, breaches, or performance issues.
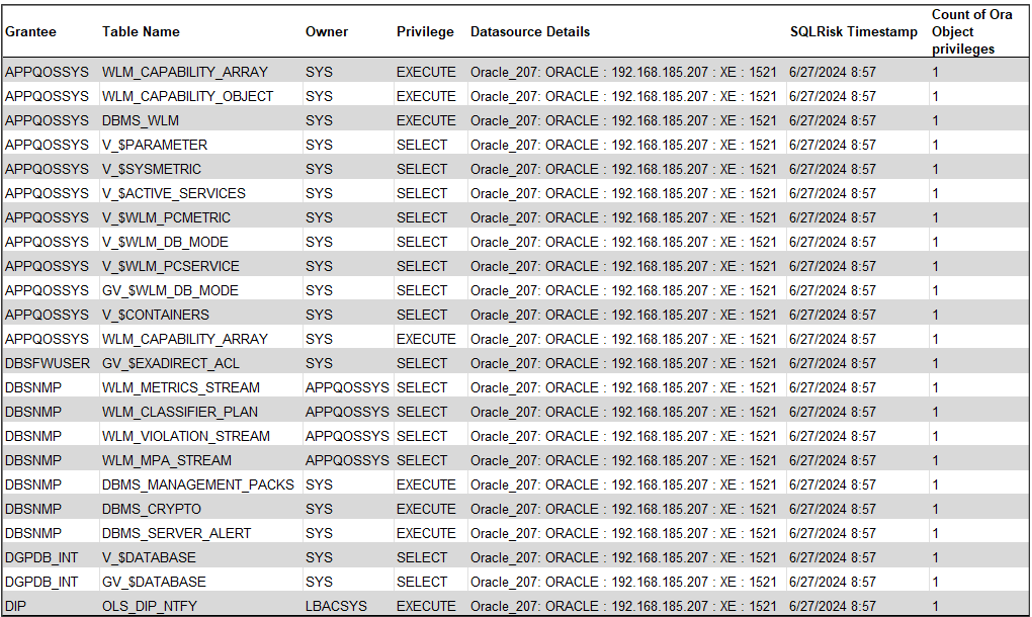
- Data Source Spectrum Reports: Generate comprehensive reports for various databases
including Oracle, MS SQL, PostgreSQL, MySQL, and MongoDB.
These reports provide detailed insights into user roles,
privilege changes, login activities, administrative actions, and more—helping
strengthen data security and governance processes.
Challenges It Solves
Data Touch addresses key data security challenges faced by organizations:
- Lack of visibility into sensitive data Inability to monitor data usage
- Difficulty tracking data changes
- Risk of data breaches
- Compliance and regulatory challenges
Integrated with Data Focus
Data Touch works seamlessly with Kafein Technology’s data governance platform, Data Focus, combining:
- Data governance
- Data security to deliver a comprehensive, end-to-end data management approach.
Who Is It For?
- Organizations with high data security and compliance requirements
- Regulated industries (finance, public sector, telecom, etc.)
- Companies managing large-scale data environments Businesses looking to monitor and control sensitive data usage
Why Kafein Technology?
- Locally developed with strong engineering capabilities
- Expertise in data security and analytics
- Proven success in enterprise-scale projects End-to-end data solutions portfolio
Request a Demo
Make your data visible, secure, and manageable with Data Touch.
👉 Request a demo or get in touch with our experts